Key Takeaways From the Blog
- Graphs model complex, real-world relationships better than linear structures.
- Vertices and edges form the core structure of all graph types.
- Many graph variations exist—directed, undirected, weighted, cyclic, planar, etc.
- Graph algorithms like DFS, BFS, Dijkstra, and MSTs solve real problems.
- Graphs power networks, AI, social media, navigation, and machine learning.
- They offer flexibility but come with memory and computational challenges.
Introduction
Graphs are fundamentally the main theme of computer science and data structures when the question arises of how to depict the complex interconnections of entities, in contrast to linear data structures such as arrays, linked lists, stacks, and queues, which store data in sequence. They find their way to be a must in the case that the relationship’s character is not of the linear or hierarchical type but is strongly interconnected.
Graphs have found their way into numerous areas such as networking, social media, artificial intelligence, database design, and transportation systems. Being familiar with their structure, representation, and applications is a must when determining efficient solutions to real-life problems or hierarchically, graphs offer a more flexible and elaborate manner of data representation.
What is a Graph in Data Structure?
A graph is a data structure that consists of a set of vertices (or nodes) and a set of edges (or arcs) that connect pairs of vertices. It is used to model relationships or connections between objects.
It can be defined as G = (V, E), where:
- V is a set of vertices.
- E is a set of edges, where each edge is a pair of vertices (for an undirected graph) or an ordered pair of vertices (for a directed graph).
What are the Components of the Graph?
A graph consists of two primary components:
- Vertices (Nodes): The individual elements or entities in the graph. It represents cities, people, or web pages.
- Edges (Links): The connections or relationships between pairs of vertices. They represent relationships such as roads between cities, friendships between people, or hyperlinks between web pages.
Types of Graphs in Data Structures
Here are the types of graphs in data structures:
1. Null Graph
A graph with no vertices and no edges. It is the most basic form of a graph, where there are no connections between any nodes.
2. Trivial Graph
A graph with exactly one vertex and no edges. It is a special case of a graph with the smallest possible number of vertices.
3. Non-directed Graph (Undirected Graph)
A graph where the edges have no direction. In other words, if there is an edge between vertex A and vertex B, it means A is connected to B, and B is also connected to A.
4. Directed Graph
A graph in which edges have a direction. Each edge is represented as an ordered pair of vertices, where the edge goes from one vertex (the source) to another (the destination).
5. Connected Graph
A graph in which there is a path between every pair of vertices. All vertices are reachable from any other vertex in the graph.
6. Disconnected Graph
A graph where some vertices are not connected to others. There are at least two disconnected components.
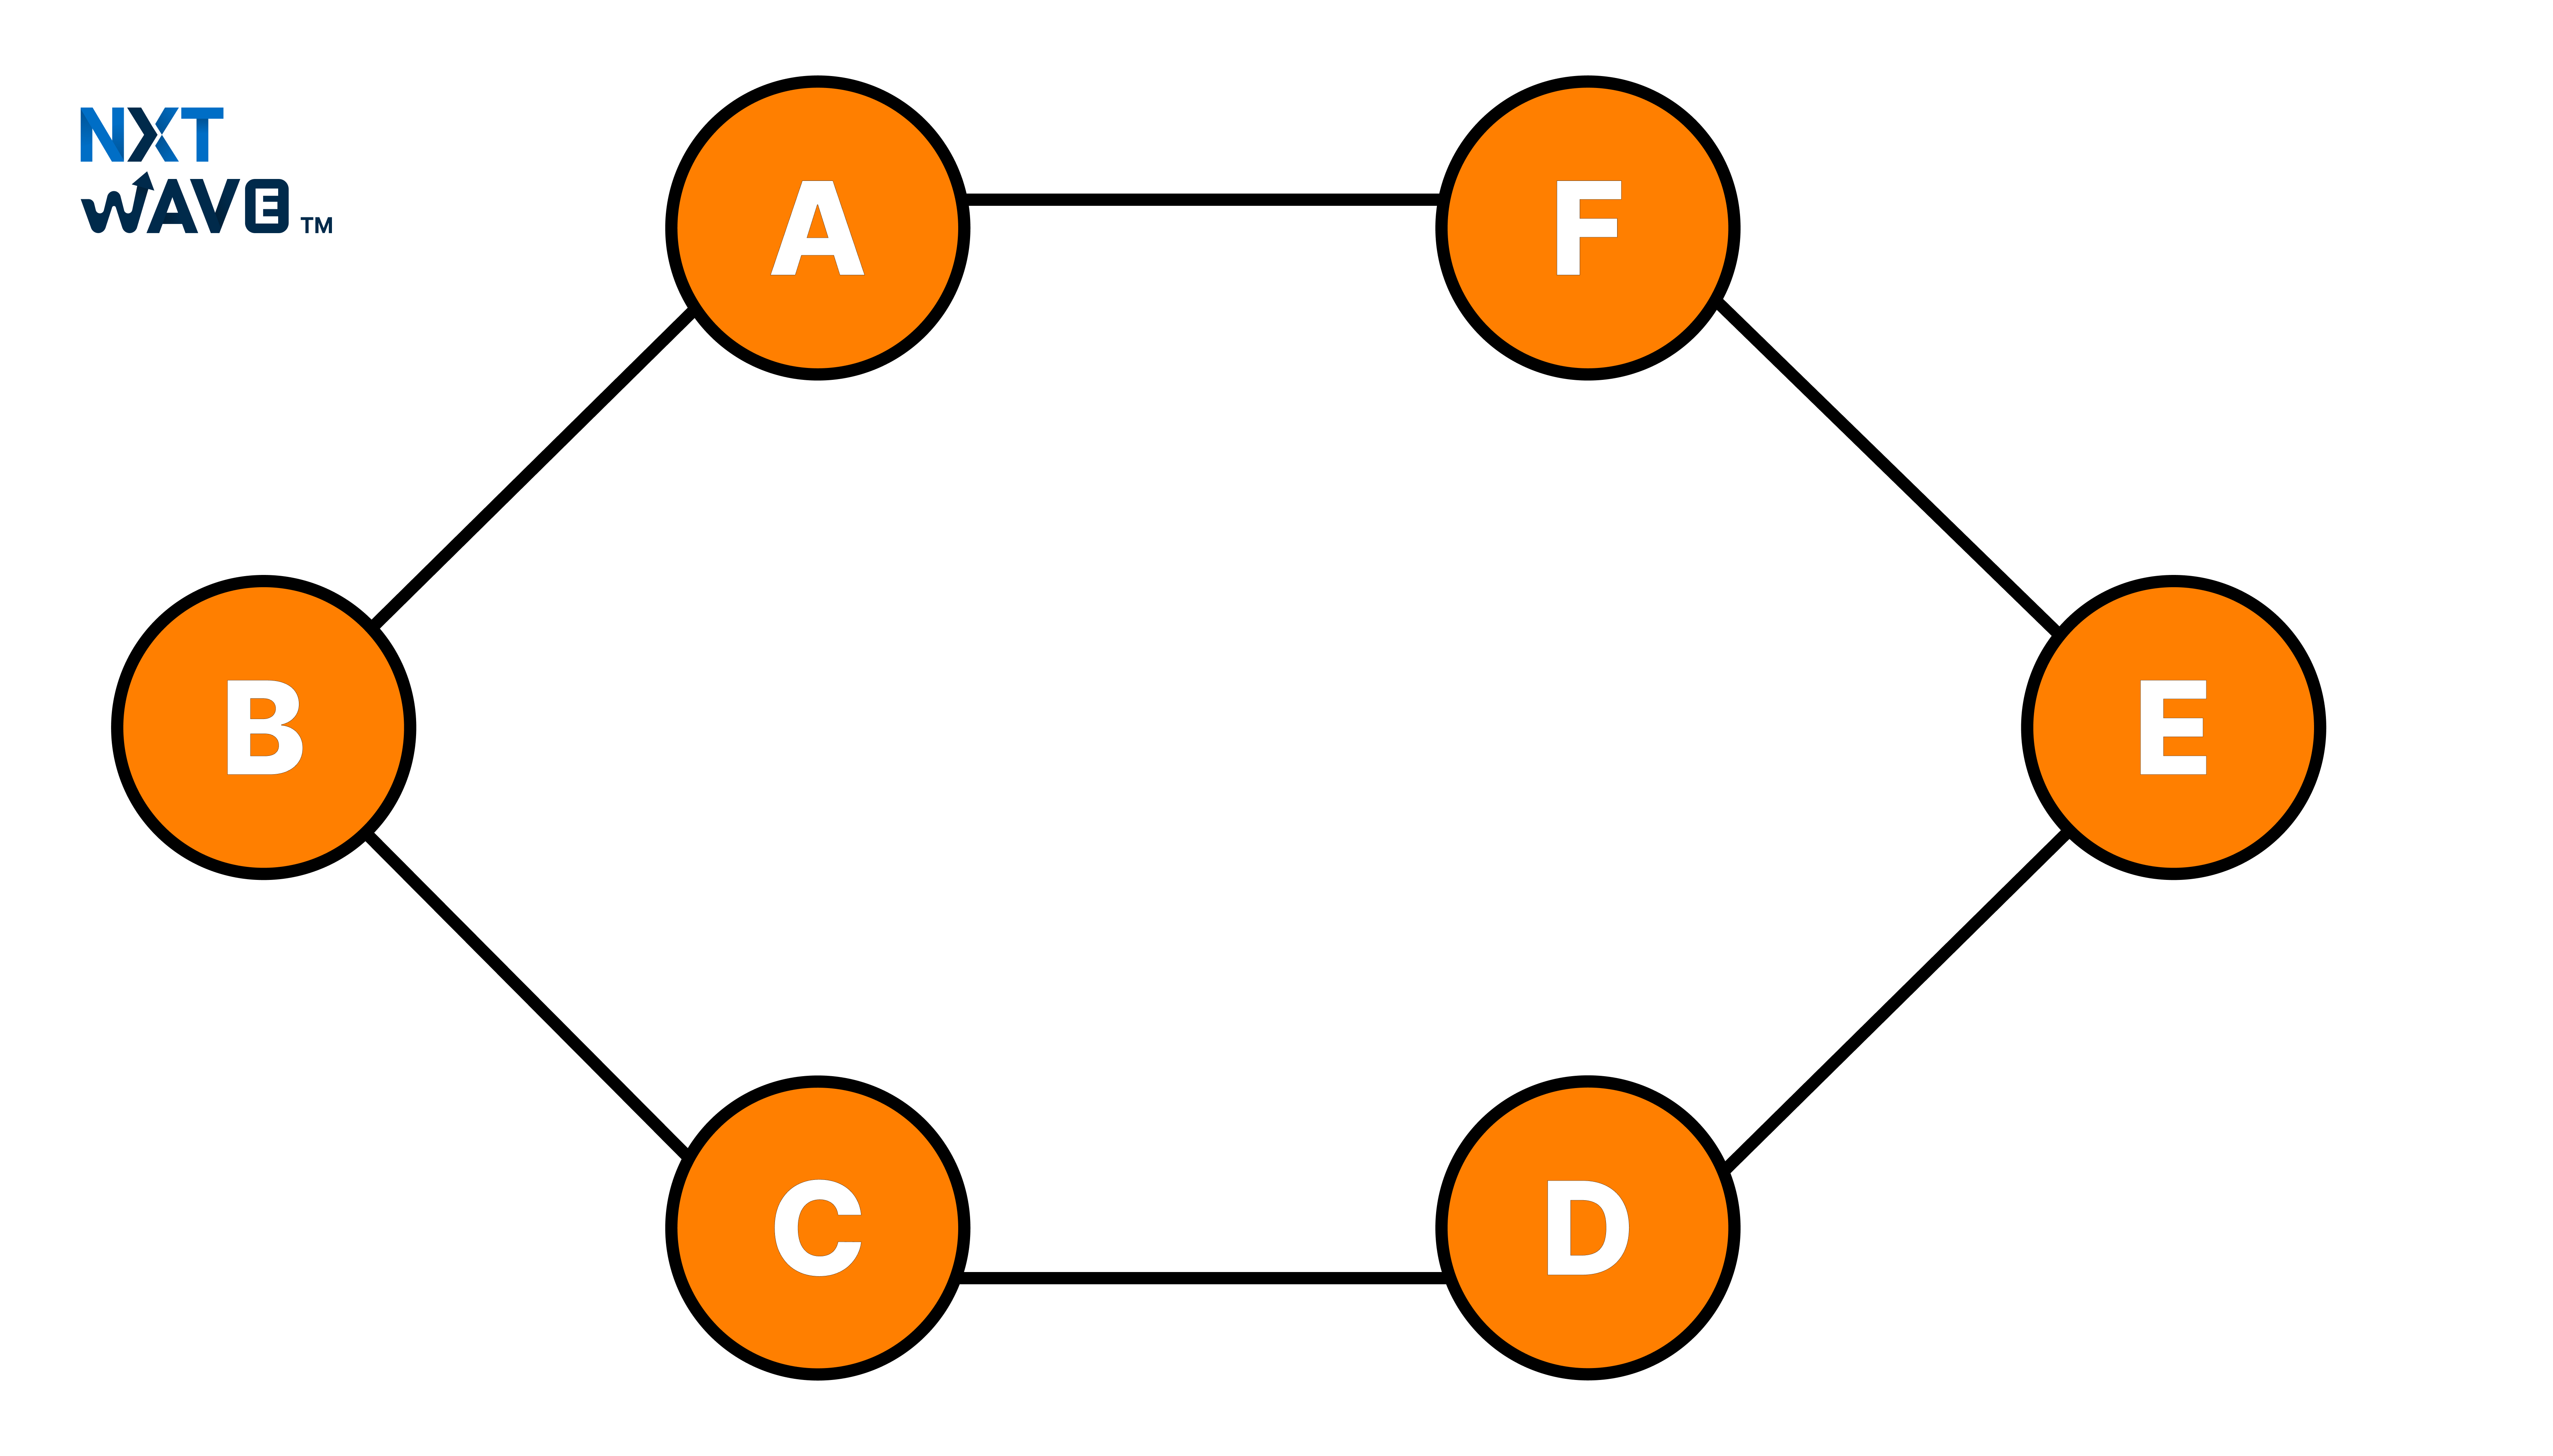
7. Cycle Graph
A graph that forms a closed loop, meaning all vertices are connected in a single cycle without any additional edges or vertices.
8. Cyclic Graph
A graph that contains at least one cycle (a closed path where the starting and ending vertex are the same). Not all cyclic graphs are cycle graphs.
9. Acyclic Graph
A graph that does not contain any cycles. In other words, there is no closed path in the graph.
10. Regular Graph
A graph where every vertex has the same number of edges (degree). A regular graph can be k-regular if every vertex has exactly k edges.
11. Complete Graph
A graph where there is an edge between every pair of vertices. In a complete graph with
n vertices, each vertex is connected to n−1 other vertices.
12. Finite Graph
The vertices and edges of a graph are finite.
13. Infinite Graph
A graph with an infinite number of vertices and/or edges.
14. Bipartite Graph
A graph where the vertices can be divided into two disjoint sets such that every edge connects a vertex in one set to a vertex in the other set. No edge exists between vertices within the same set.
15. Simple Graph
The graph consists of no loops (edges connecting vertices together) or multiple edges between vertices.
16. Multi Graph
It is a graph in which two vertices can have multiple edges connecting them. In other words, there can be more than one edge connecting the same pair of vertices.
17. Labeled Graph
A labeled graph is a graph where each vertex and/or edge is assigned a label or identifier. These labels could represent unique names or properties associated with vertices or edges.
18. Sub Graph
A subgraph is a subset of a graph, where some vertices and edges of the original graph are selected. A subgraph must include all edges whose endpoints are in the selected vertices.
19. Pseudo Graph
A pseudograph is a graph that allows both multiple edges (parallel edges) between the same pair of vertices and self-loops (edges that connect a vertex to itself).
20. Planar Graph
A planar graph is a graph that can be drawn on a plane with its edges. In other words, there exists a way to draw the graph such that two edges intersect each other.
21. Euler Graph
The Euler graph in which there exists a closed trail (Eulerian circuit) that visits every edge exactly once. A graph is Eulerian if all of its vertices have an even degree (the number of edges incident to the vertex).
22. Hamilton Graph
A graph that contains a Hamiltonian cycle that visits each vertex exactly once and returns to the starting vertex. A graph is Hamiltonian if there exists a cycle that passes through every vertex once and only once.
Key Takeaways So Far
- Graphs are made of vertices and edges.
- There are different types of graphs to use depending on the computational tasks.
- Knowing graph classes helps to decide the right graph to use.
- Graphs like Euler, Hamilton, and planar graphs being special ones, are used to solve different types of problems.
Graph Representations
Graphs can be represented in multiple ways in computer memory, each with its advantages and disadvantages.
1. Adjacency Matrix
An adjacency matrix is a 2D array of size V×VV \times VV×V, where VVV is the number of vertices. The element a[i][j]a[i][j]a[i][j] indicates whether there is an edge from vertex iii to vertex jjj.
- Advantages:
- Simple and easy to implement.
- Checking if an edge exists is O(1)O(1)O(1).
- Disadvantages:
- Requires O(V2)O(V^2)O(V2) space, which is inefficient for sparse graphs.
2. Adjacency List
An adjacency list represents a graph as an array of lists. Each vertex has a list containing all adjacent vertices.
- Advantages:
- Space-efficient for sparse graphs.
- Easier to traverse neighbors.
- Disadvantages:
- Checking for the existence of a specific edge can be slower, O(V)O(V)O(V) in the worst case.
3. Other Representations
- Edge List: A list containing all the edges. It is helpful for edge processor algorithms.
- Incidence Matrix: A 2D array where rows stand for vertices and columns for edges. It is a very limited use kind of graph.
Bottom Line: The most suitable graph representation determines the time, space and algorithm complexity of the real-world applications.
Graph Algorithms and Their Applications
Graphs are not just static data structures; they are essential for various algorithms that solve practical problems.
1. Traversal Algorithms
Graph traversal is the process of visiting all vertices in a graph systematically.
a. Depth-First Search (DFS)
- Explores as far as possible along a branch before backtracking.
- Applications:
- Detecting cycles in a graph.
- Solving puzzles and games (e.g., maze solving).
- Topological sorting of tasks in scheduling problems.
b. Breadth-First Search (BFS)
- Explores all neighbors at the current depth before moving to the next level.
- Applications:
- Finding the shortest path in unweighted graphs.
- Web crawling and social network analysis.
- Level-order traversal in tree structures.
2. Shortest Path Algorithms
Graphs are often used to find the most efficient route between nodes.
- Dijkstra’s Algorithm: Finds the shortest path from a source node to all other nodes in a weighted graph (non-negative weights).
- Bellman-Ford Algorithm: Handles graphs with negative weights and detects negative cycles.
- Floyd-Warshall Algorithm: Computes shortest paths between all pairs of vertices.
Applications:
- GPS navigation systems.
- Network routing protocols.
- Urban traffic planning.
3. Minimum Spanning Tree (MST) Algorithms
MST algorithms find a group of edges that link all vertices and have the least total weight.
- Prim's Algorithm: Constructs the MST by including edges with the least weight that connect the existing tree to a new vertex.
- Kruskal's Algorithm: Constructs MST by picking the edge of the least weight that causes no cycles.
Applications:
- Designing cost-effective network layouts.
- Electrical grid optimization.
- Cluster analysis in machine learning.
4. Connectivity Algorithms
Graphs are also used to verify if a graph is connected or to identify connected components.
- Tarjan’s Algorithm: Identifies strongly connected components in directed graphs.
- Union-Find (Disjoint Set): Handles connectivity queries in undirected graphs efficiently.
Applications:
- Network reliability analysis.
- Social network community detection.
- Image segmentation in computer vision.
5. Graph Coloring and Scheduling
Graph coloring involves assigning colors to vertices so that no two adjacent vertices share the same color.
Applications:
- Register allocation in compilers.
- Task scheduling problems.
- Frequency assignment in wireless networks.
6. Network Flow Algorithms
Network flow issues depict scenarios that involve the movement of assets from a starting point to an end point.
- Ford-Fulkerson Algorithm: Calculates the largest flow that can pass through a network.
- Edmonds-Karp Algorithm: BFS-based implementation for locating augmenting path
Applications:
- Traffic and transportation optimization.
- Internet data flow and bandwidth allocation.
- Supply chain and logistics planning.
7. Graph Matching and Optimization
Graph matching algorithms find optimal pairings in bipartite graphs.
Applications:
- Job assignment problems.
- Dating and recommendation systems.
- Resource allocation in distributed systems.
Key Takeaways So Far
- Graph algorithms solve routing, scheduling, optimization, and analysis problems.
- BFS/DFS handle traversal and structure discovery.
- MST and shortest path algorithms optimize networks.
- Flow and matching algorithms power logistics and recommendations.
Real-World Applications of Graphs
Graphs are a concept that can be found in any field of technology that we use daily without realizing it:
- Social Networks: The vertices correspond to the users, and the edges represent the relationships. Communities, influencers, and content recommendation are identified by an algorithm.
- Computer Networks: Routers and switches are the nodes; connections are the edges. Graph algorithms are used to route optimally, detect faults, and plan changes.
- Search Engines: Web pages are nodes, and hyperlinks are edges. Google's PageRank algorithm applies the graph model to rank pages.
- Transportation Systems: Cities or intersections are vertices, and roads are edges. The shortest path, traffic flow, and route planning problems are solved by graph algorithms.
- Recommendation Systems: Graphs represent users and products; edges indicate interactions. Algorithms predict user preferences.
- Biology: Proteins, genes, and molecules are nodes; their interactions are edges. Graphs help in understanding molecular pathways, disease networks, and drug discovery.
- AI and Machine Learning: Knowledge graphs are the main characters/entities and the relationships between them, thus helping natural language understanding, question answering, and reasoning.
- Game Development: Graphs represent maps, levels, or decision trees for AI pathfinding and strategic planning.
Quick Note: Graphs mirror real-world connections, powering everything from social networks to transportation, ML models, biological systems, and AI reasoning.
How Graphs are Used in Machine Learning and AI
Graphs play a crucial role in Machine Learning and AI:
- GNN (Graph Neural Network) uses graph-based data for tasks like node classification, link prediction, and graph classification. These are used in social network analysis, recommendation systems, and drug discovery.
- Graph-Based Search Algorithms: In AI, algorithms like A search* or Depth-First Search (DFS) are used to explore graphs for solving problems like pathfinding or decision-making.
- In AI, knowledge graphs are used to represent relationships between entities, which enables better understanding, reasoning, and decision-making, particularly in natural language processing (NLP).
- Graphs are also used to detect communities or clusters within datasets, which is essential in social network analysis and market segmentation.
Advantages of Graphs in Data Structures
Here are the advantages of graphs in data structures:
- Graphs can represent complex relationships between objects flexibly and efficiently.
- Graphs allow for efficient search and traversal algorithms, such as Depth-First Search (DFS) and Breadth-First Search (BFS)
- Graphs can handle large amounts of data and scale well with the size of the input, making them suitable for big data applications.
- Graphs can represent a wide range of data structures, including trees, lists, and matrices, making them versatile data structures.
- Graphs can be used to model real-world phenomena, such as social networks, transportation systems, and communication networks, making them a powerful tool for modeling and analyzing complex systems.
- Graphs can improve performance in certain applications, such as recommendation systems, by allowing for efficient querying and retrieval of data.
- Graphs can handle missing or noisy data, making them a robust data structure for real-world applications.
Challenges and Considerations in Using Graphs
While powerful, graphs come with challenges:
- Space Complexity: Dense graphs can consume significant memory.
- Time Complexity: Traversals and algorithms can be computationally expensive.
- Dynamic Graphs: Handling graphs that change over time adds complexity.
- Visualization: Large graphs are difficult to represent visually.
Optimizing graph storage and algorithms for efficiency is a major area of research in computer science.
Bottom Line: Graphs excel at modeling complex, real-world connections but demand careful handling of memory, computation, and visualization as they scale.
Conclusion
Graphs are at the base of nearly all data structures in the present world and provide a versatile method to represent complex relationships. Their usage goes from simple traversal and connectivity up to sophisticated machine learning applications and, thus, they are to be found in almost every branch of computer science and even outside it. Knowledge of graph models, algorithms, and usage is a must if one wants to be able to solve problems involving interconnections, relationships, and networks.
The applications of graphs are limitless: in social networking, transportation, logistics, AI, and biology, graphs provide a framework to model and solve problems efficiently. Mastery of graph theory and its computational techniques equips software engineers, data scientists, and researchers with powerful tools for innovation in diverse domains.
Why It Matters?
Graphs are the core elements of almost all modern computing systems, they are involved in the likes of navigation, networking, AI reasoning, and recommendation engines. With their help, we can represent complex interconnected relationships which cannot be broken down into simpler linear structures. Grasping the concept of graphs gives students the ability to not only solve real-world problems in an efficient manner but also to come up with the designs of smart systems that can scale.
Practical Advice for Learners
- Initially, work on creating graph structures that are straightforward with the help of adjacency lists and adjacency matrices.
- Get familiar with essential algorithms such as BFS, DFS, Dijkstra, and Kruskal to develop your intuition gradually.
- Convert your graphs into understandable formats with the help of visualization tools such as Graphviz or networkx.
- Work on practical graph problems that can be used for routing, friend suggestions, or clustering tasks.
- Dive into futuristic concepts like Graph Neural Networks and knowledge graphs to understand how AI is evolving.
Boost Your Placement Chances by Learning Industry-Relevant Skills While in College!
Explore ProgramFrequently Asked Questions
1. How are graphs used in real life?
Graphs are used in many real-life applications like social networks (representing people and their connections), routing algorithms (for navigation), and recommendation systems (like those used by Amazon or Netflix).
2. What are specialized graphs and their uses?
Specialized graphs include bipartite graphs, which are used for matching problems, and tree graphs, which are used in hierarchical structures. Planar graphs are used in geographical mapping, and dependency graphs are used in project management.